Categories
Out of Policy Expense Analysis

I created this visualization using this OAC_TD_Expenses.xlsx dataset from this Oracle LiveLabs Workshop.
However, I did not follow the workshop and made my own scenario with the data:
You are an accountant for a company.
Management wants to better understand employee expenses.
The company has agreements with certain vendors to save money (in-policy vendors), but employees do not always have to use these vendors and may use out-of-policy vendors.
You are given access to the employee expense records of the past few months in Oracle Analytics.
Your mission is to analyze employee expenses and give management suggestions on what can be done to reduce employee expenses. If you see areas that have an opportunity for process improvement, point those out too.
You will use Oracle Analytics to perform this task.
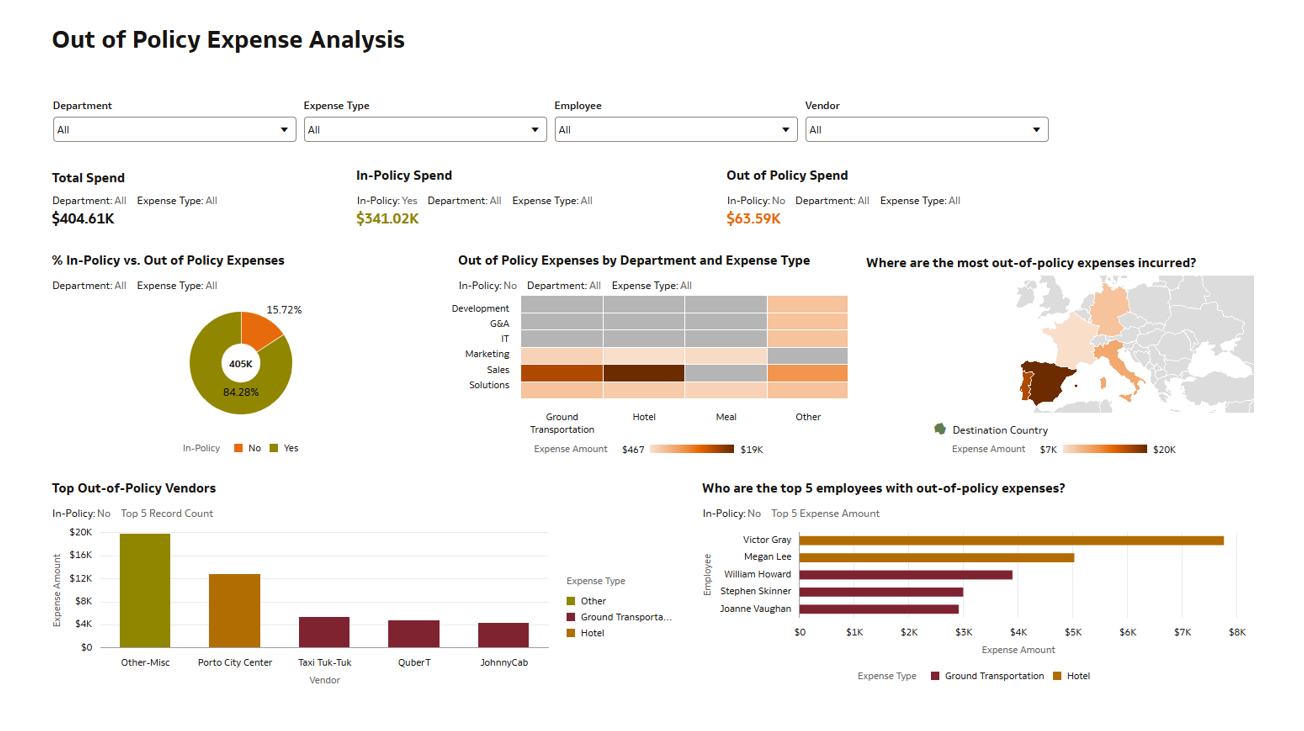
With this visualization, I was able to conclude the following:
- Speak to the Sales department on why they are using out-of-policy hotels, such as "Porto City Center." Is it because the hotels are close to customers? Interviewing the department and the employees that stayed here may lead us to consider working out an discount agreement with the hotel to save money in the future.
- Suggest to the team that maintains the employee expense application that we should remove the "Other-Misc" option. Having this category as an option is inhibiting further analysis.
Editing to add a few helpful hints:
Select a template upon opening the workbook, and change the workbook theme.
Choose a color scheme before you start (versus after). Seeing a fresh color scheme helps me be more creative when mocking up these demos.


Comments
-
Beautiful viz & the presentation. The explanation is very helpful.
Thanks for sharing @Jamie Anderson-Oracle!
1 -
Great work, @Jamie Anderson-Oracle! Thanks for clearly explaining the context behind what you were exploring in the dataset. I really appreciate the analysis insights you shared—they really help deepen the understanding and show just how impactful your data visualization can be. Also, huge thanks for including your helpful hints. Super useful!
2 -
Nice one. Thank you for sharing the details.
2


